STAFF BLOG
Goodbye paper towels, hello zero-waste alternative!
A DIY tutorial for reusable “Unpaper” towels.
Almost everyone uses paper towels! They’re so handy and absorbent and always right there when you need them. But, have you ever stopped to wonder what environmental impact paper towels have? When you look at the entire lifecycle of a piece of paper towel there are many behind-the-scenes inputs or processes that we wouldn’t normally consider. For example harvesting trees, transporting raw materials or finished products, chemical inputs (from forestry or pulp mill), fresh water usage, water treatment, transport to stores/consumers, and of course the disposal in the landfill. One calculation of the global warming potential for paper towel (the amount of greenhouse gasses that are emitted by the cradle to grave production and consumption of a product interpreted as mass of carbon dioxide) was about 0.06 lbs or 27 grams of carbon dioxide for each towel produced and used. So, the mass of carbon dioxide produced outweighs the paper towel itself (roughly 2 grams per sheet) thirteen times over. If you use 5-10 pieces of paper towel in a day, after one year your paper towels would generate the equivalent of 109-219 lbs of carbon dioxide [1]. The use of paper towels is therefore contributing to climate change through greenhouse gas emissions and leads to unnecessary paper and plastic waste.
Paper towels are made in a similar way to other popular paper products like cardboard, writing paper, and tissues. Each of these products is molded from a pulp that contains a mixture of small pieces of wood and water. Producing these sources of materials requires trees, chemicals, fuel, water, and electricity - contributing to millions of metric tons of emissions annually. While manufacturing causes many issues like pollution and the reduction of natural resources like trees and water, the disposal of these towels is also an issue [2].
Although paper towels are compostable, they often end up in the landfill and will not be made into usable compost. In addition, excessive plastic packaging around a pack of paper towels also contributes to waste production at your local landfill.
Interested in finding an alternative to paper towels?
There are options other than traditional paper towels that will still help you wipe, dry, and clean with fewer negative impacts on the environment! Plus, they will even help save on costs. The average family uses two rolls of paper towel every week. At roughly $3.20 for 2 rolls [3] that equals out to $166 in paper towels yearly.
Some alternatives include cotton napkins, rags, sponges, etc. Switching to a reusable option will save you money in the long run and reduce your paper towel consumption/waste! Since these reusable options are small towels, they can sneak in with your regular laundry, too. One eco-suggestion would be to stick with natural fiber cloths (i.e. cotton based) since frequently machine washing fabrics made of synthetic materials can contribute to microplastic pollution in waterways.
Keep reading below to learn how to DIY our favourite paper towel alternative!
Our DIY ‘Unpaper Towel’ Tutorial
Sewing Machine Required
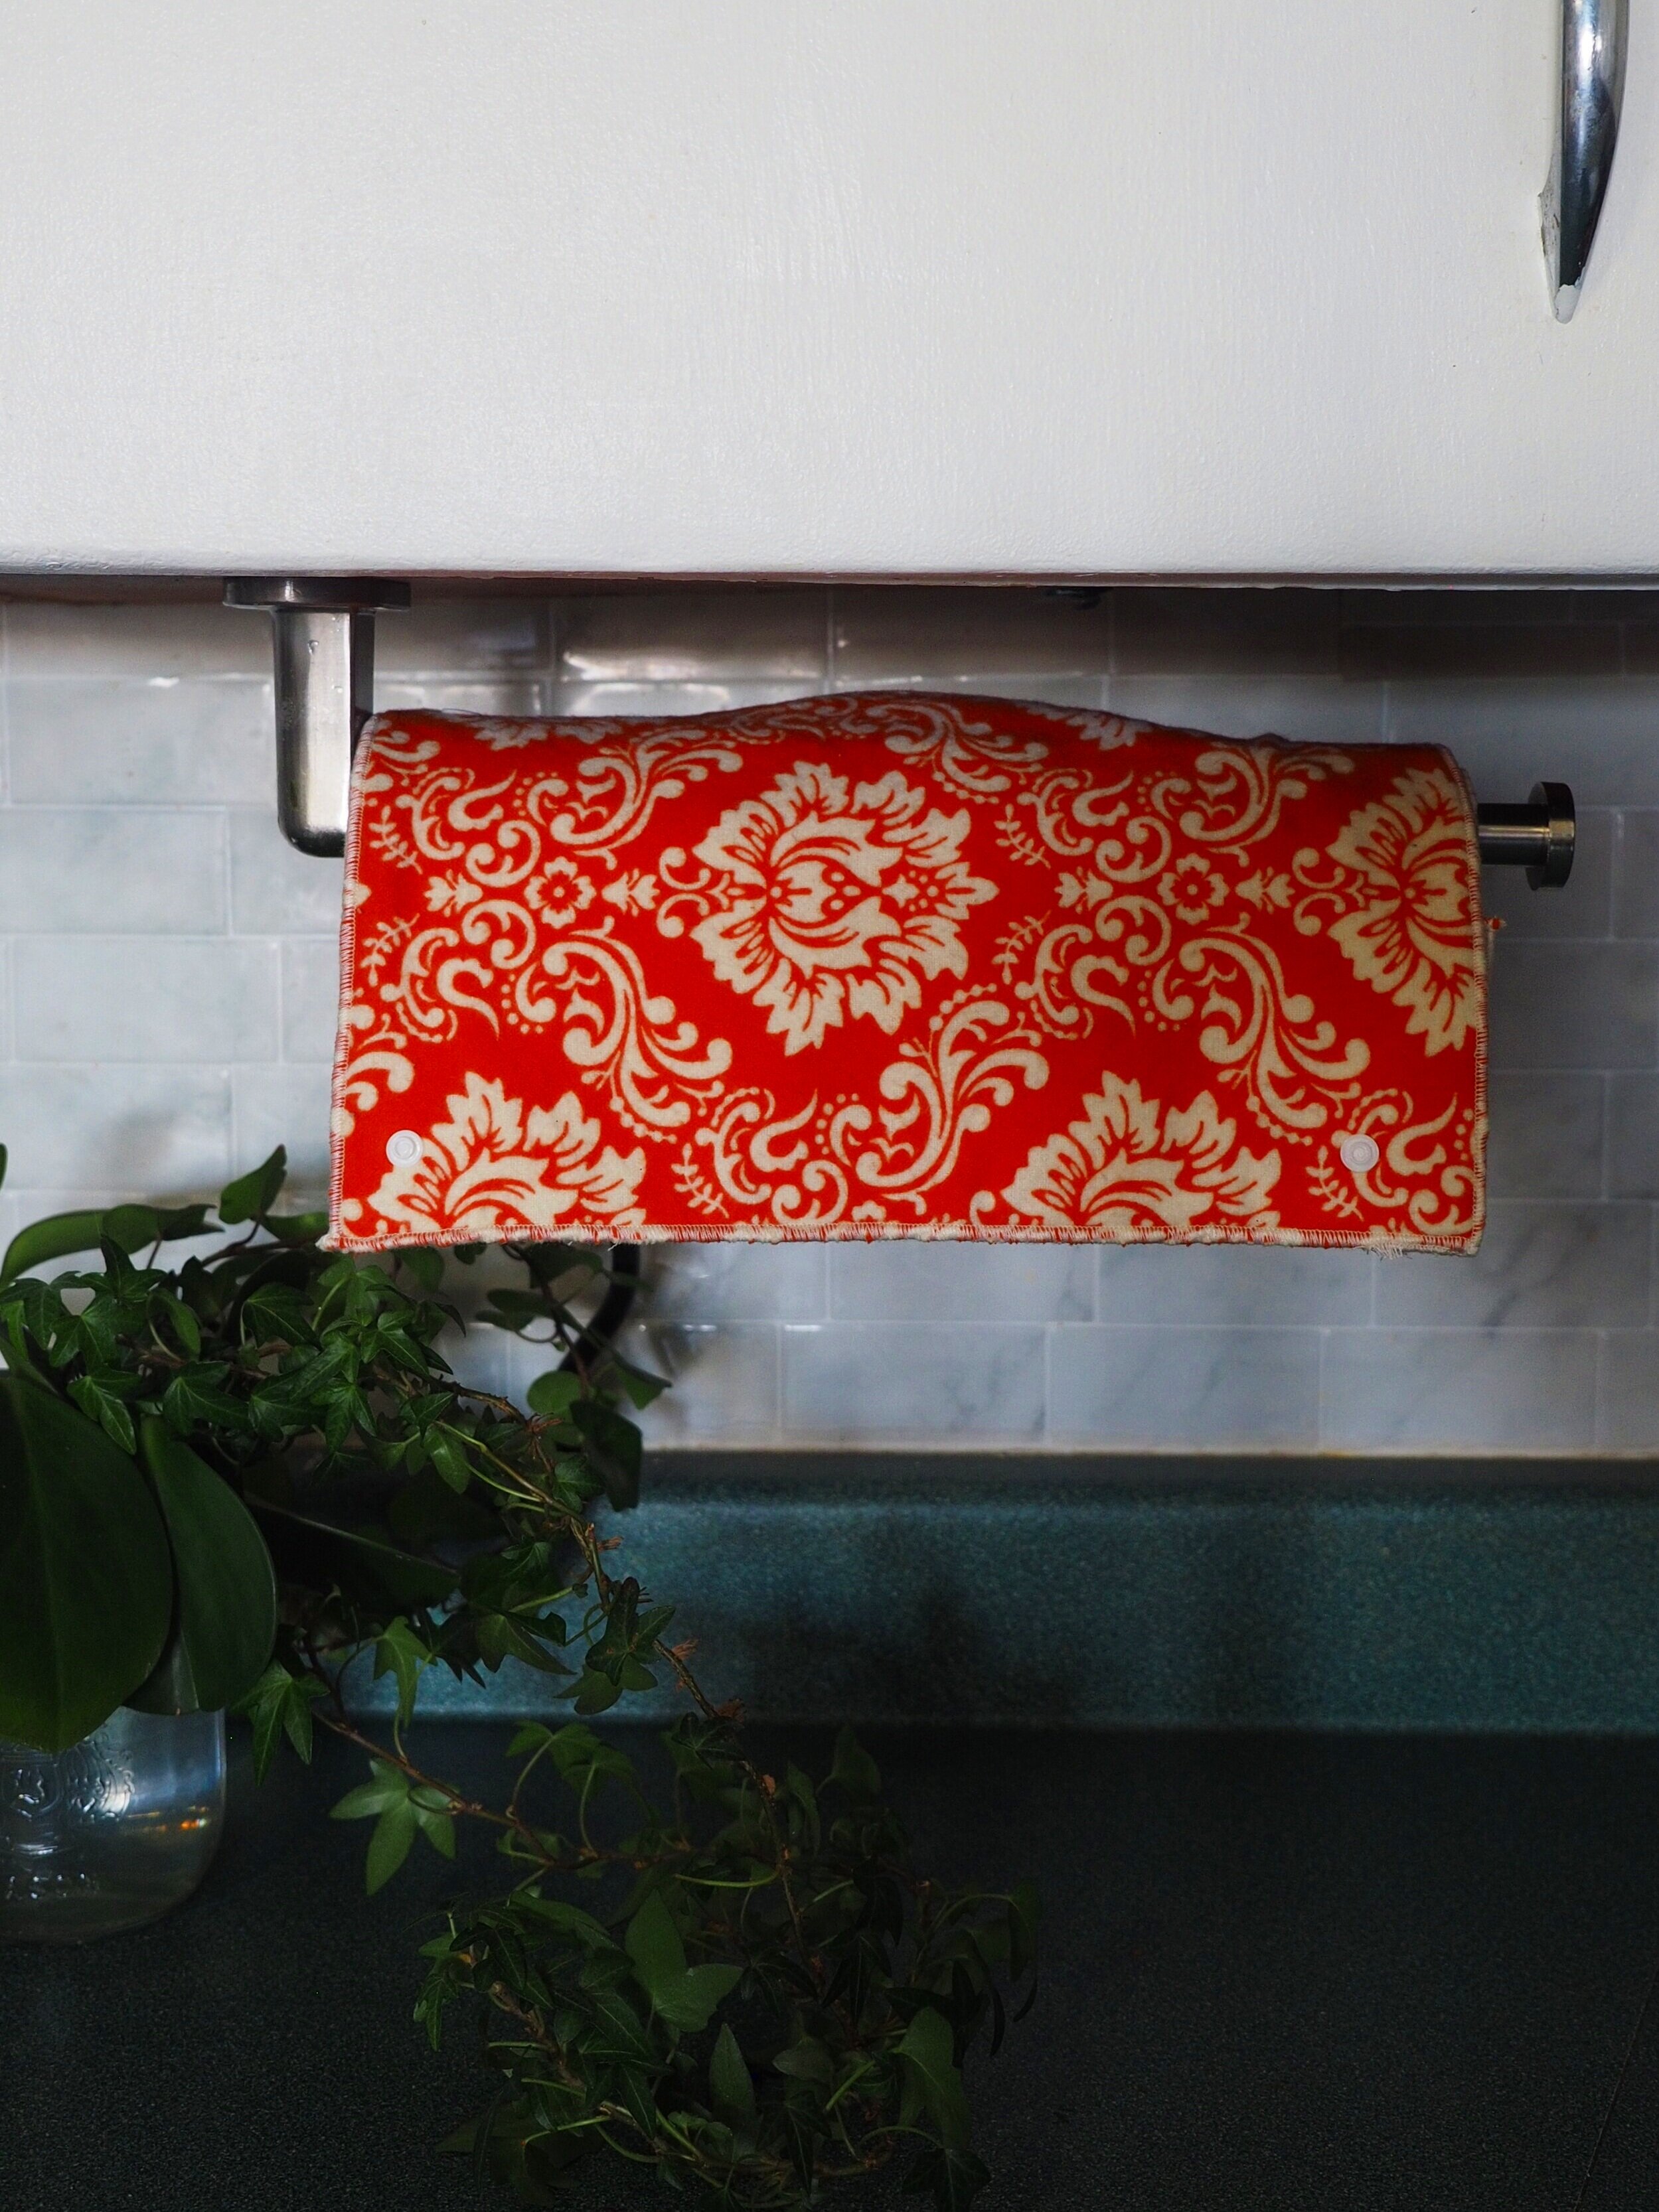
Unpaper Towels are reusable towels that attach together so you can still have them on a roll on your counter and keep them accessible. But when you are done, you wash and reuse them instead of throwing them away leading to less waste in your trash and you’ll save money buying fewer paper towels! These towels are a homemade, DIY option that are easy to make right at home with the proper equipment!
What you’ll need
Absorbent natural fiber fabric (i.e. flannel, terrycloth, muslin cloth) - 2 meters of flannel is $16, or even better, repurpose old flannel shirts/jammies for free
Sharp scissors
Sewing machine or serger
Thread
Ruler
Iron
Optional if adding snaps to towels:
An empty paper towel roll
Fusible interfacing (local fabric store) - 1 meter is $5
4 plastic snaps per towel (local fabric store) - 1 package is $13
Snap setting tool - $24
Altogether this will make about 30 single-ply towels or 15 two-ply towels. Without the snap option this will cost roughly $16 for fabric or FREE if repurposing old clothing!
Making these towels with the snaps will cost roughly $58 for fabric and snaps/snap setter tool.
These towels will last for years, so no matter what option you choose, you will be saving money and reducing your waste!
As an FYI when deciding between snaps or no snaps, with enough care the flannel towels without snaps can still be rolled up together and displayed like traditional paper towel since the towels stick together. You could also put them in a cute basket or drawer.

Step 1: Get your absorbent fabrics ready
Here we purchased new flannel material, which is an absorbent cotton fabric. In this tutorial we will be creating two-ply towels from this fabric but you can also use something like terry cloth or muslin fabric on one side of the towels to mix things up, or, as mentioned above repurpose flannel shirts/jammies to use!

Step 2: Wash and dry any brand new fabrics
No need for soap! Washing brand new fabric in warm water will pre-shrink them, which is important to do before stitching them together.

Step 3: Iron fabric
Take a few minutes to iron your fabrics before you begin sewing. This will make the stitching process run smoothly.

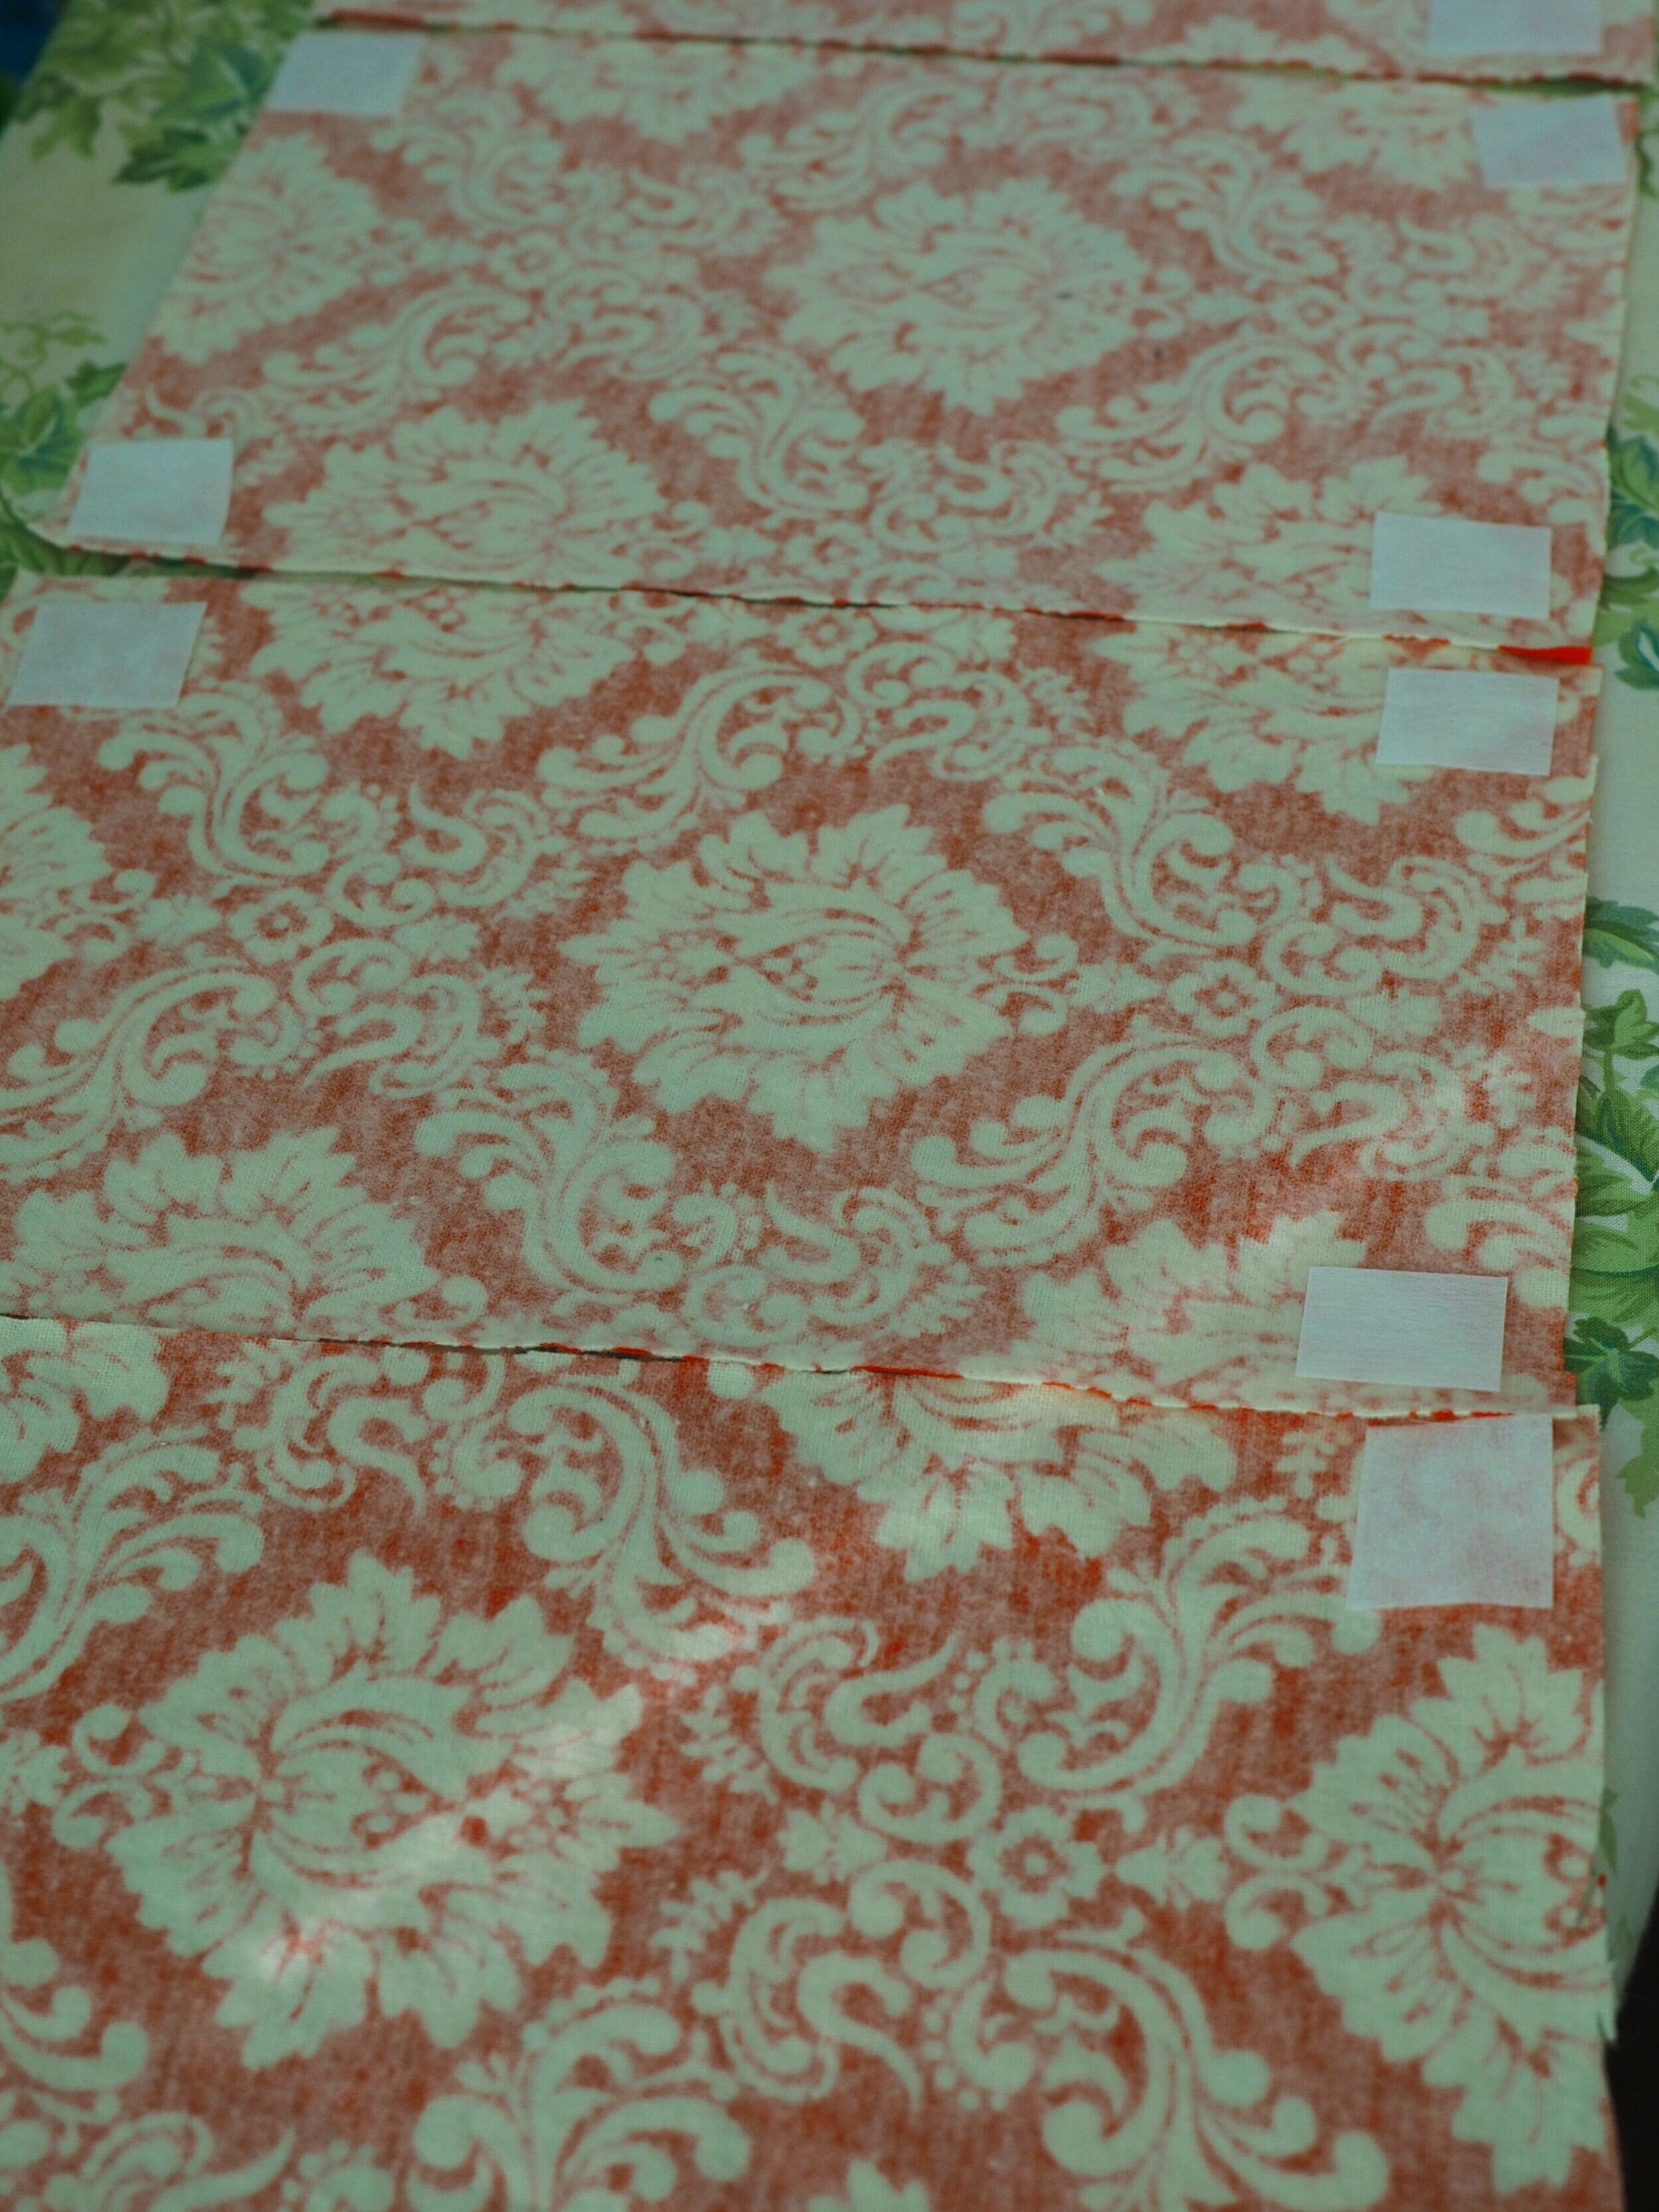
Step 4: Cut your fabric
Cut your fabric into the size you want your towels to be. Our fabric was cut to 11” x 7” because a paper towel roll is 11” long, but really you can make your towels whatever size you like!
Step 5: Add interfacing to corners (for two-ply snap option)
This step is helpful if you will be adding snaps to your unpaper towels. Add small pieces of fusible interfacing to each corner on the WRONG side of the fabric only where the snaps will connect. You just need to do this to one “ply”. This is a material that will help stabilize the fabric, adding support for holding the snaps securely in place.
Skip this step if you’re just making single-ply towels or if you’re not using snaps.
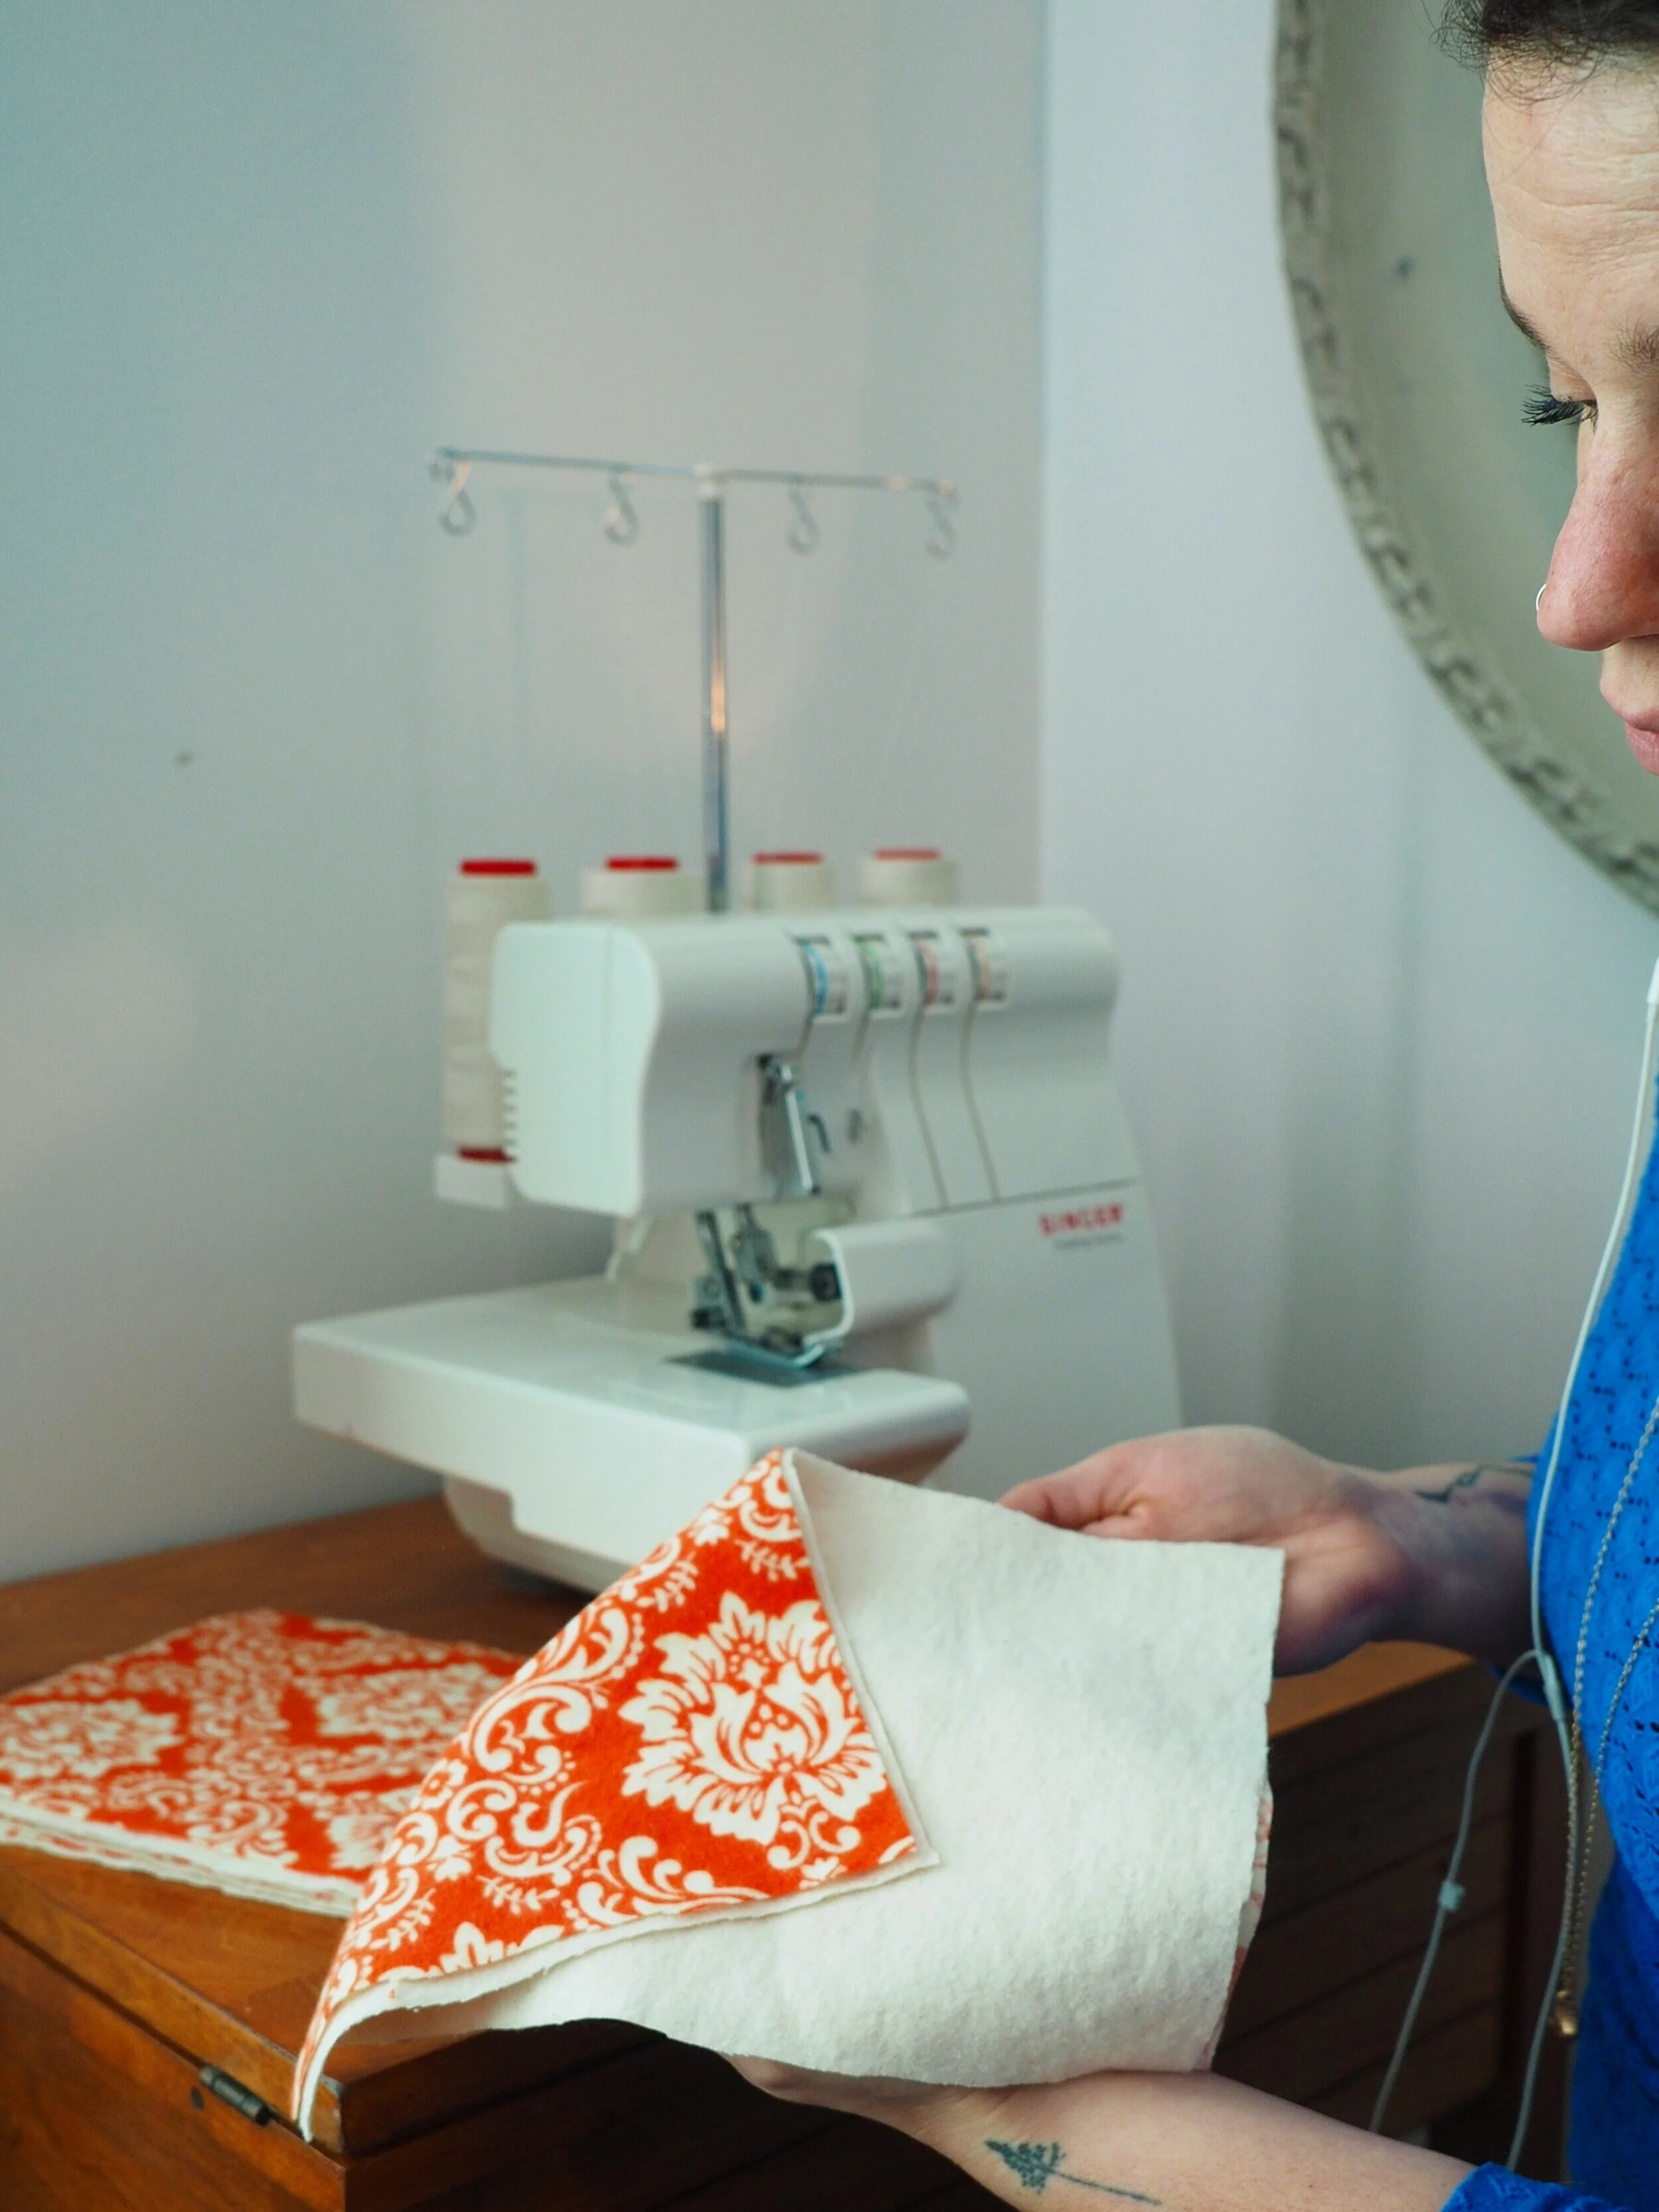
Step 6: Assemble and start stitching!
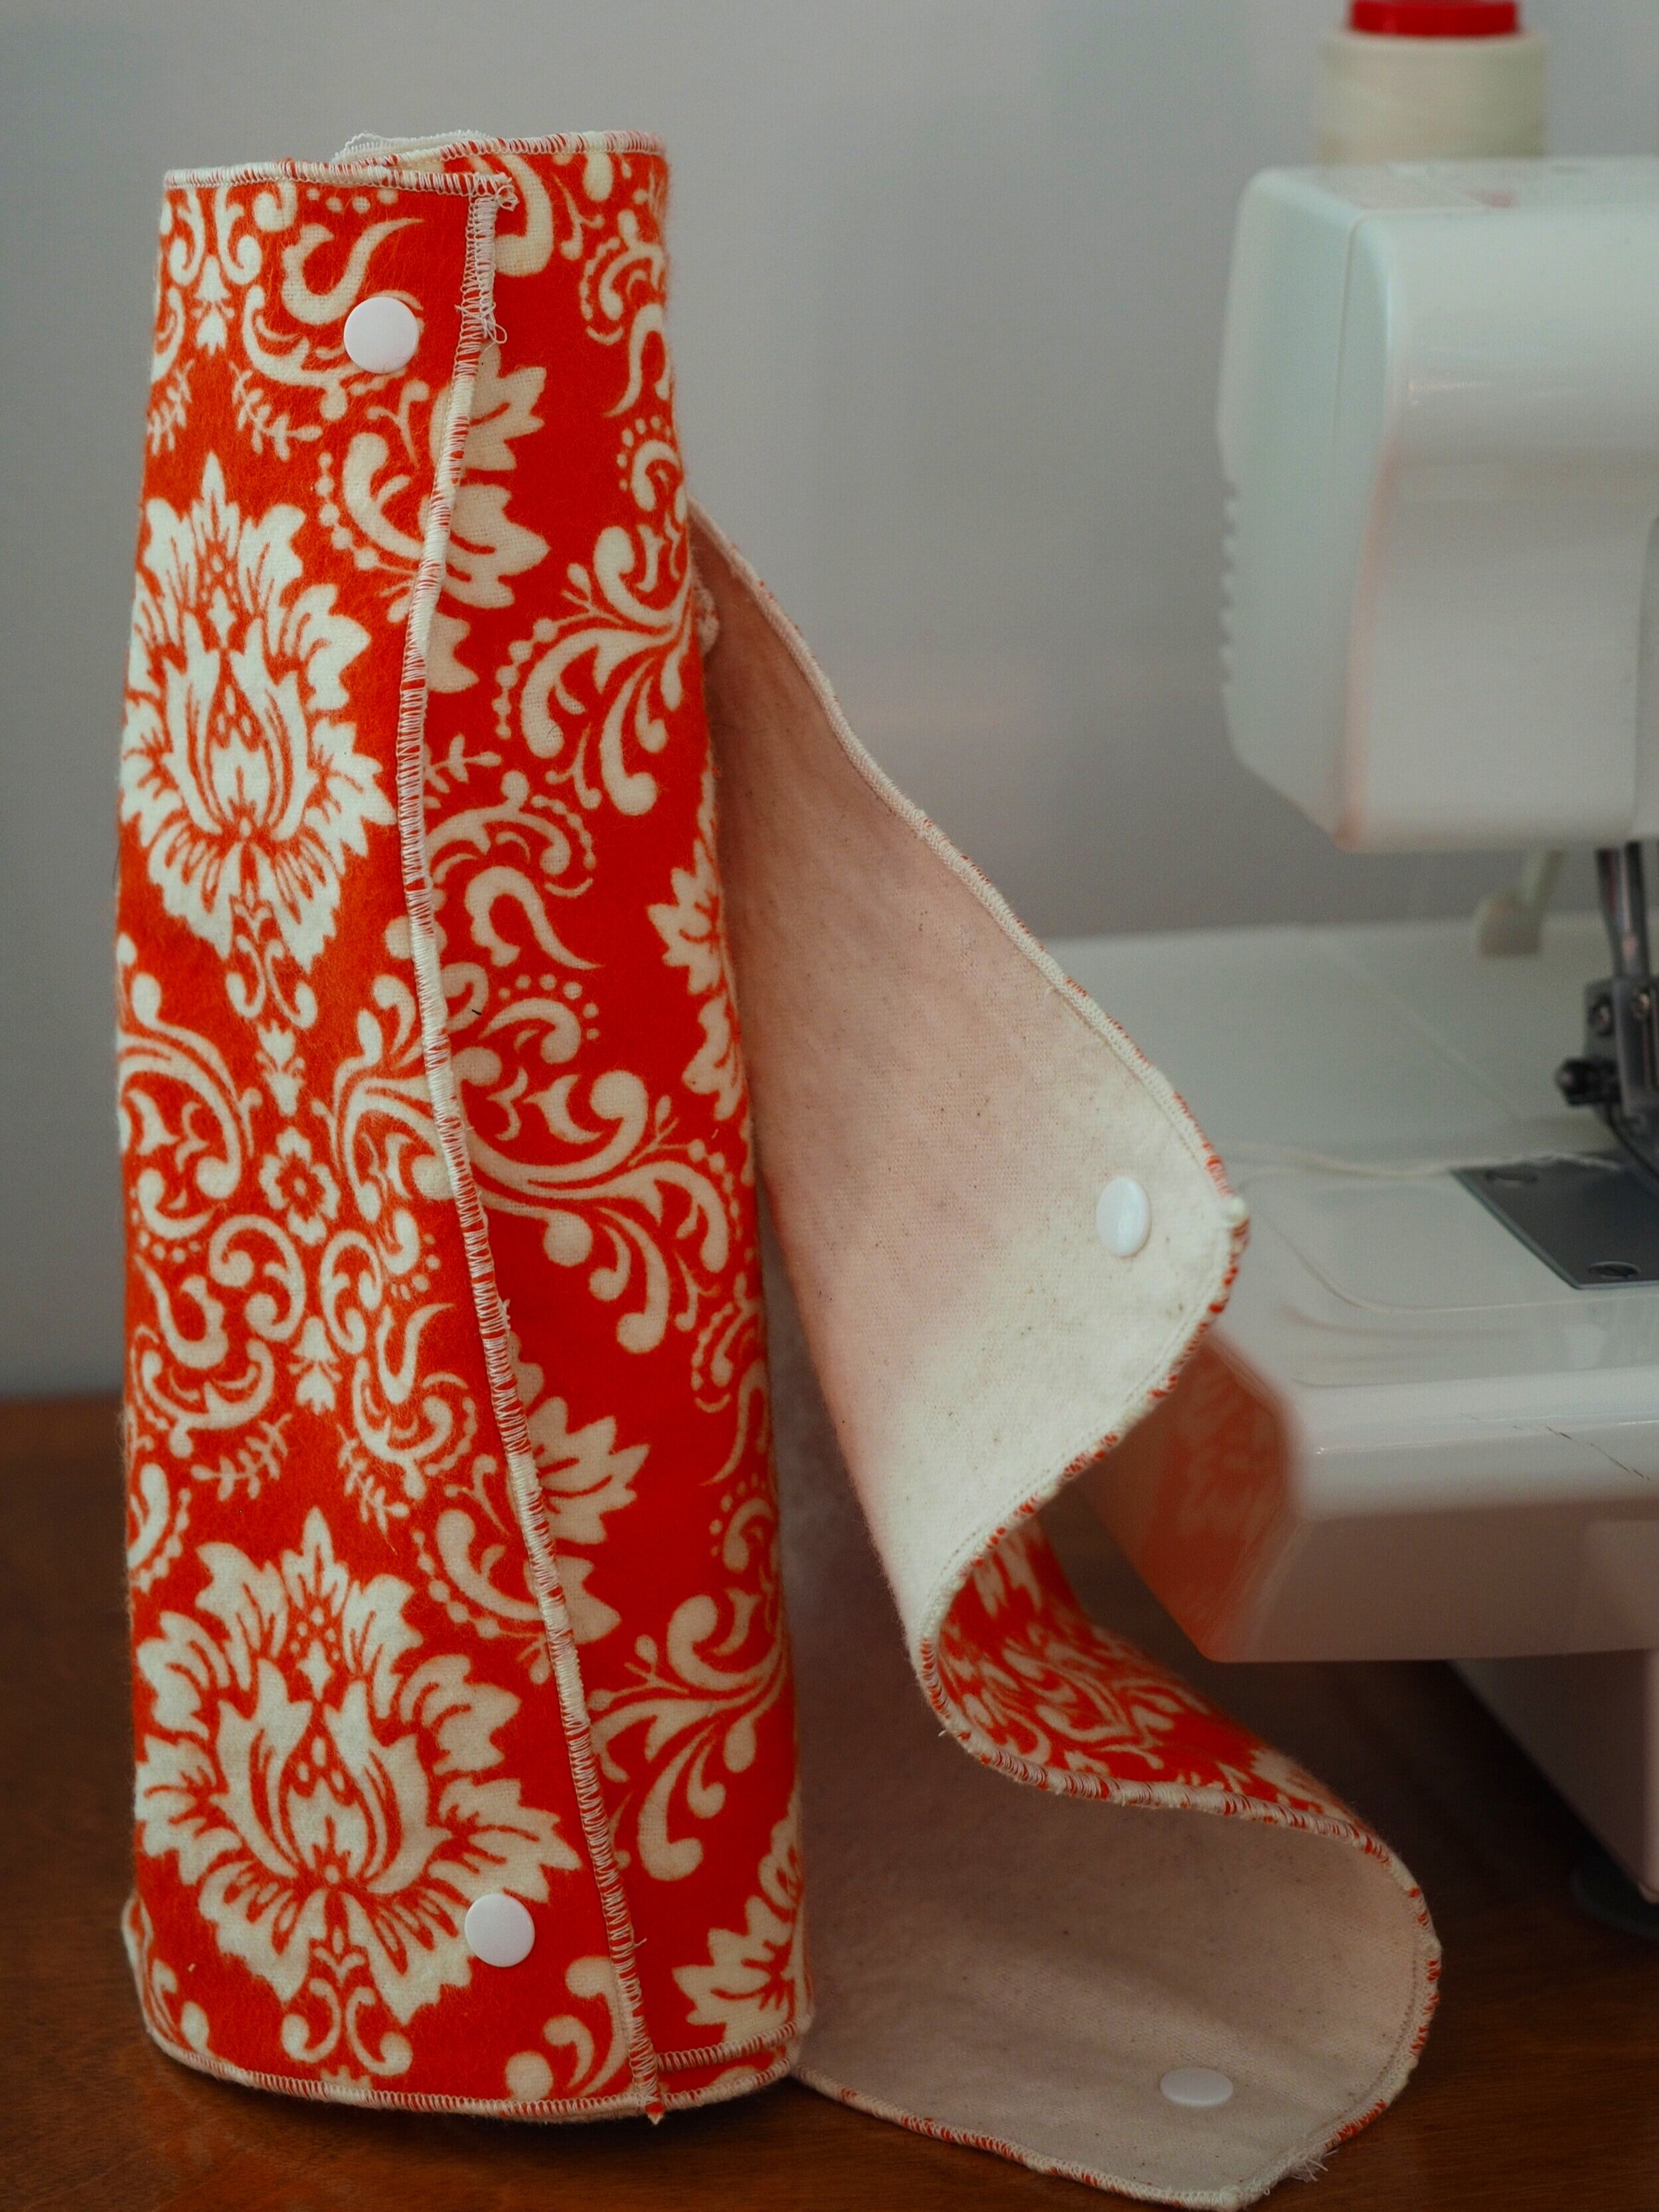
If you’re making two-ply towels, as shown in these photos, put the fabrics together with the right sides out so that the interfacing is sandwiched between the two pieces of flannel. You can then stitch all four seams of each sheet.
If making single-ply, go straight to stitching the four sides! These towels were made with a serger using a rolled hem. Any stitch meant for finishing seams would work, such as an overlock or a zig-zag stitch.

Alternatively, to hide the seams you could stitch the pieces of fabric together with the wrong-sides facing out, leaving a 3” gap at the end, then flip the towels right-side out before finishing the stitches. This way seemed more complicated to us and we don’t mind seeing the seams on the exterior.
If you are making single-ply towels without snaps you’re already done!! Lay them all out flat, overlapping each towel onto the previous piece, then roll them onto a repurposed paper towel roll. Or just stack those babies in a cute wicker basket and get ready to wipe up messes while reducing both your consumption and waste!

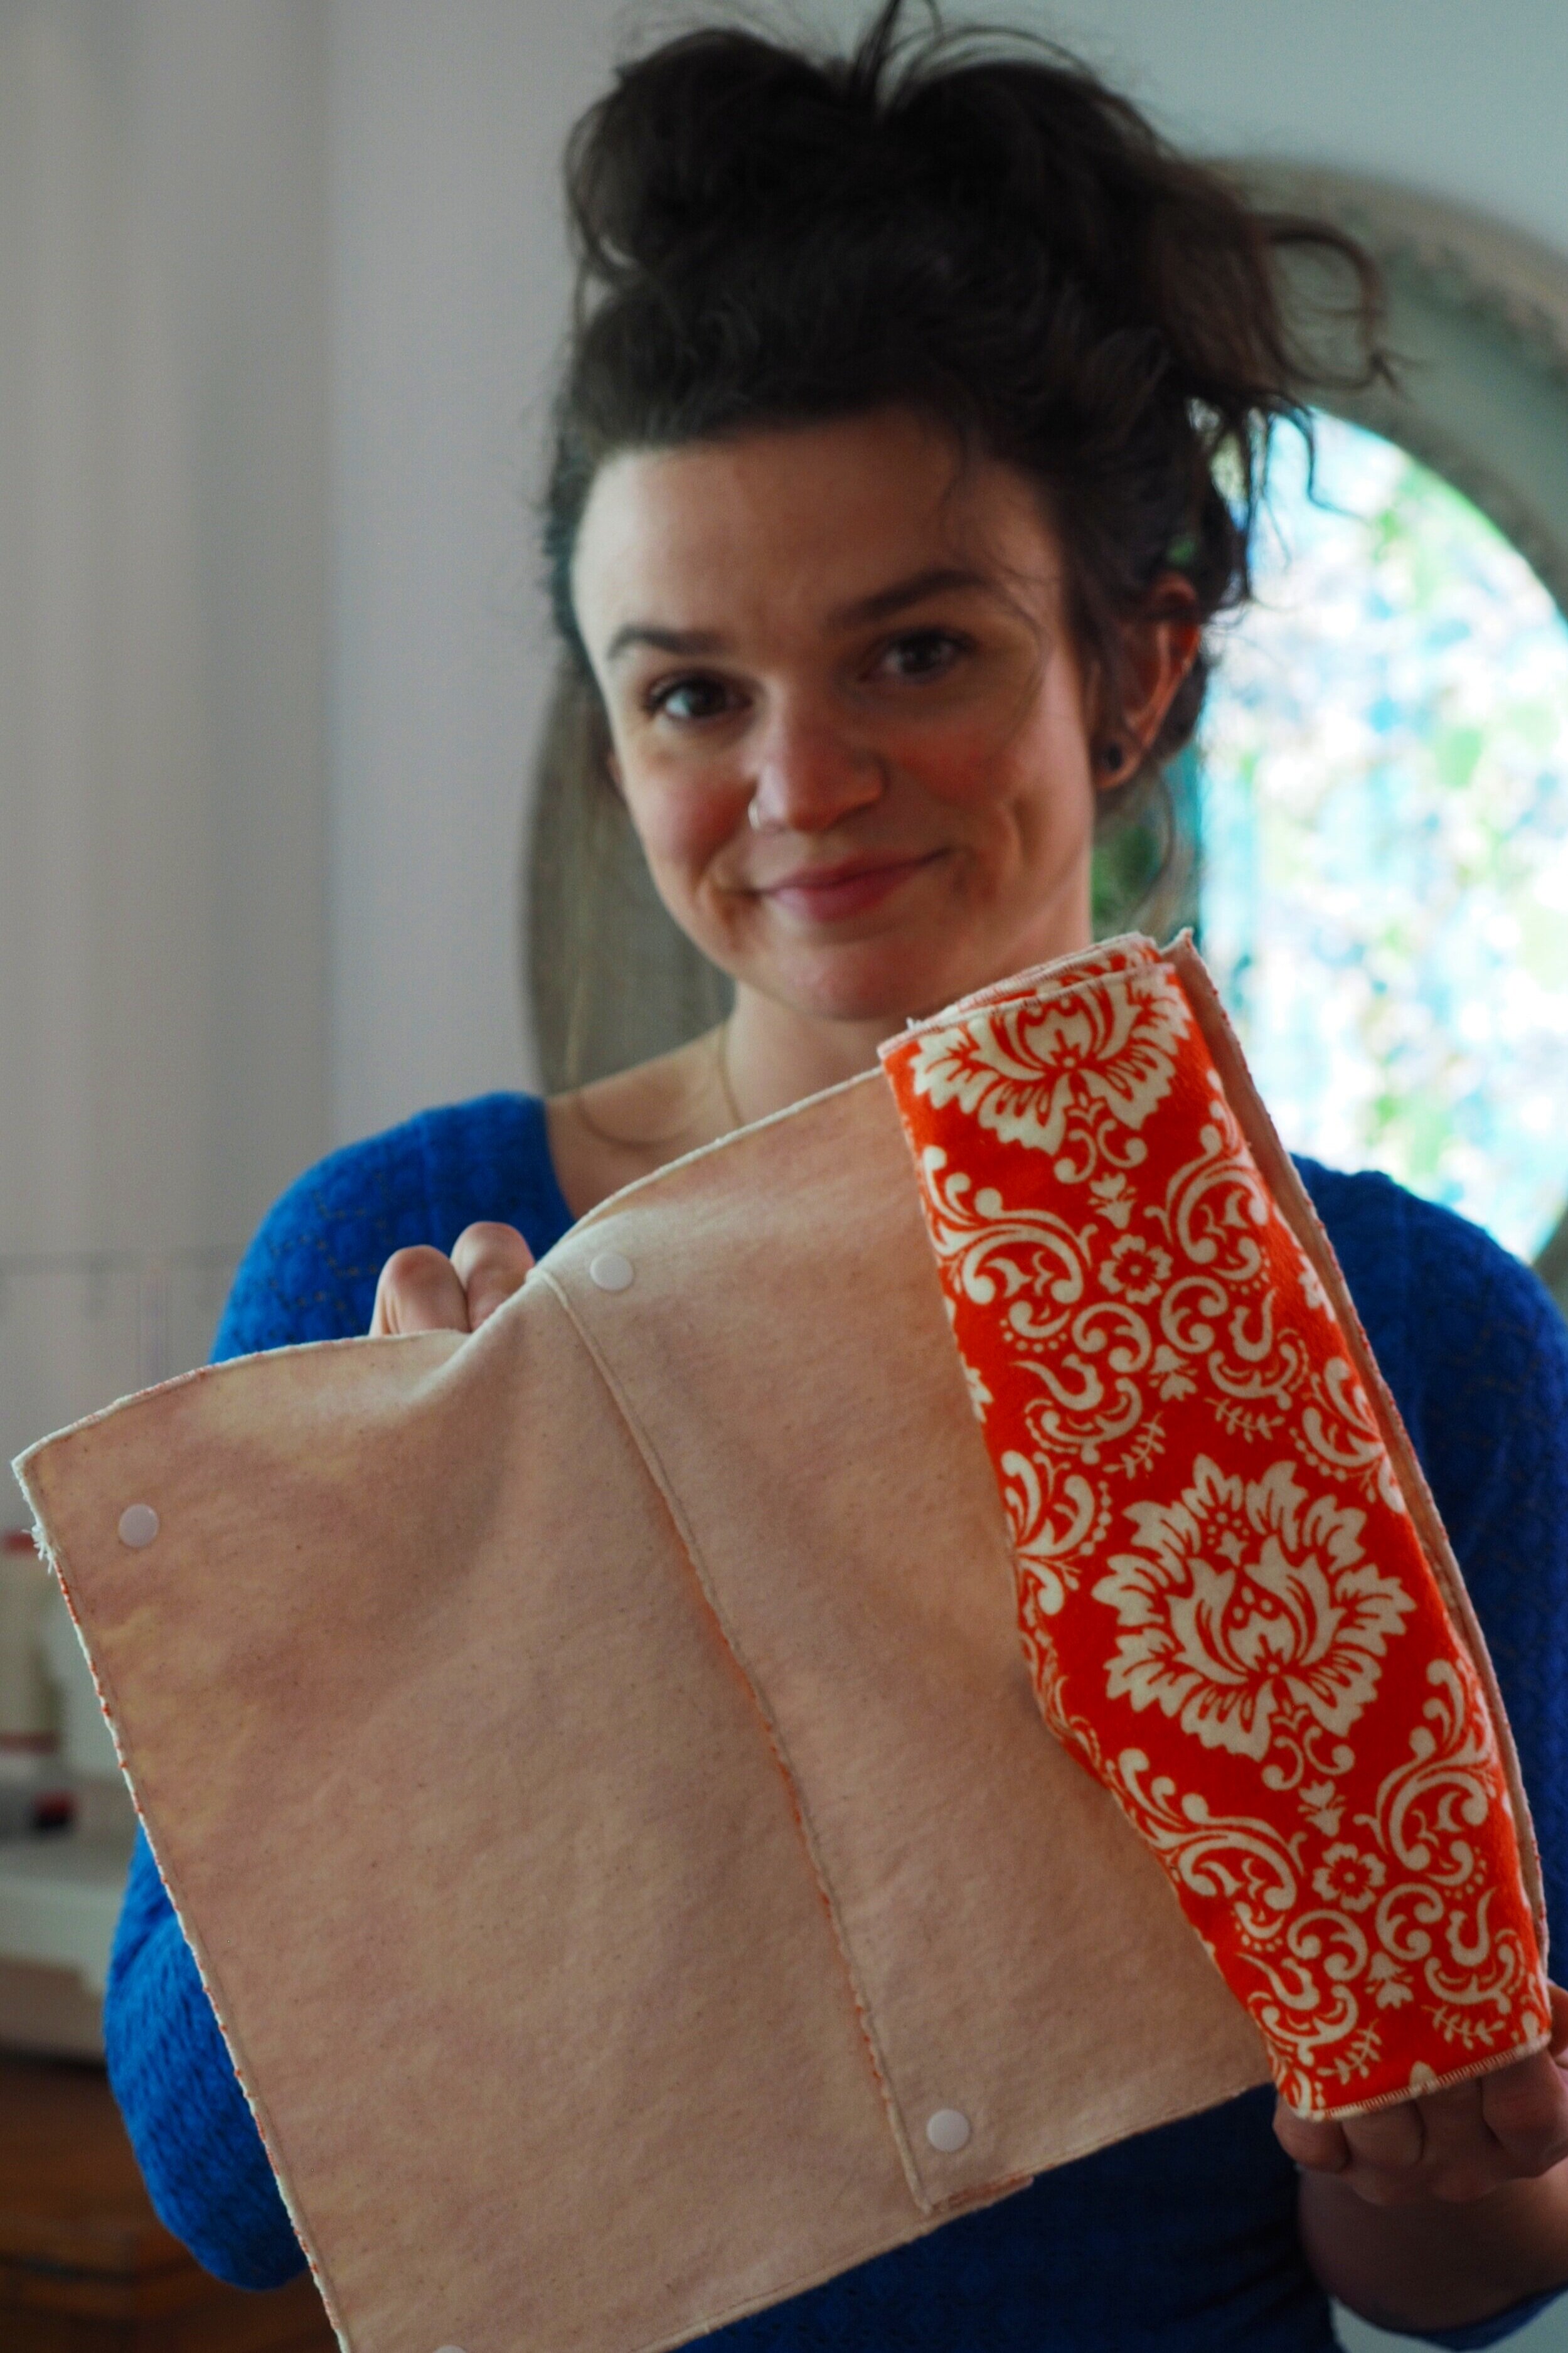
Step 7: Installing the snaps (only for snap option)
Mark the corners of each towel where the snaps will connect. These snaps were placed roughly 9” apart near each corner. We used plastic snaps so that they won’t scratch any surfaces while cleaning. The applicator used here is a Dritz Plastic Snap Plier Kit from our local fabric store.

When installing these snaps we made sure the two sockets or female components of were consistently pointing down through each towel on one long edge, while the two studs or male components were installed pointing up through the fabric on the opposite long edge. This way the towels always connect to the previous piece in the same way.

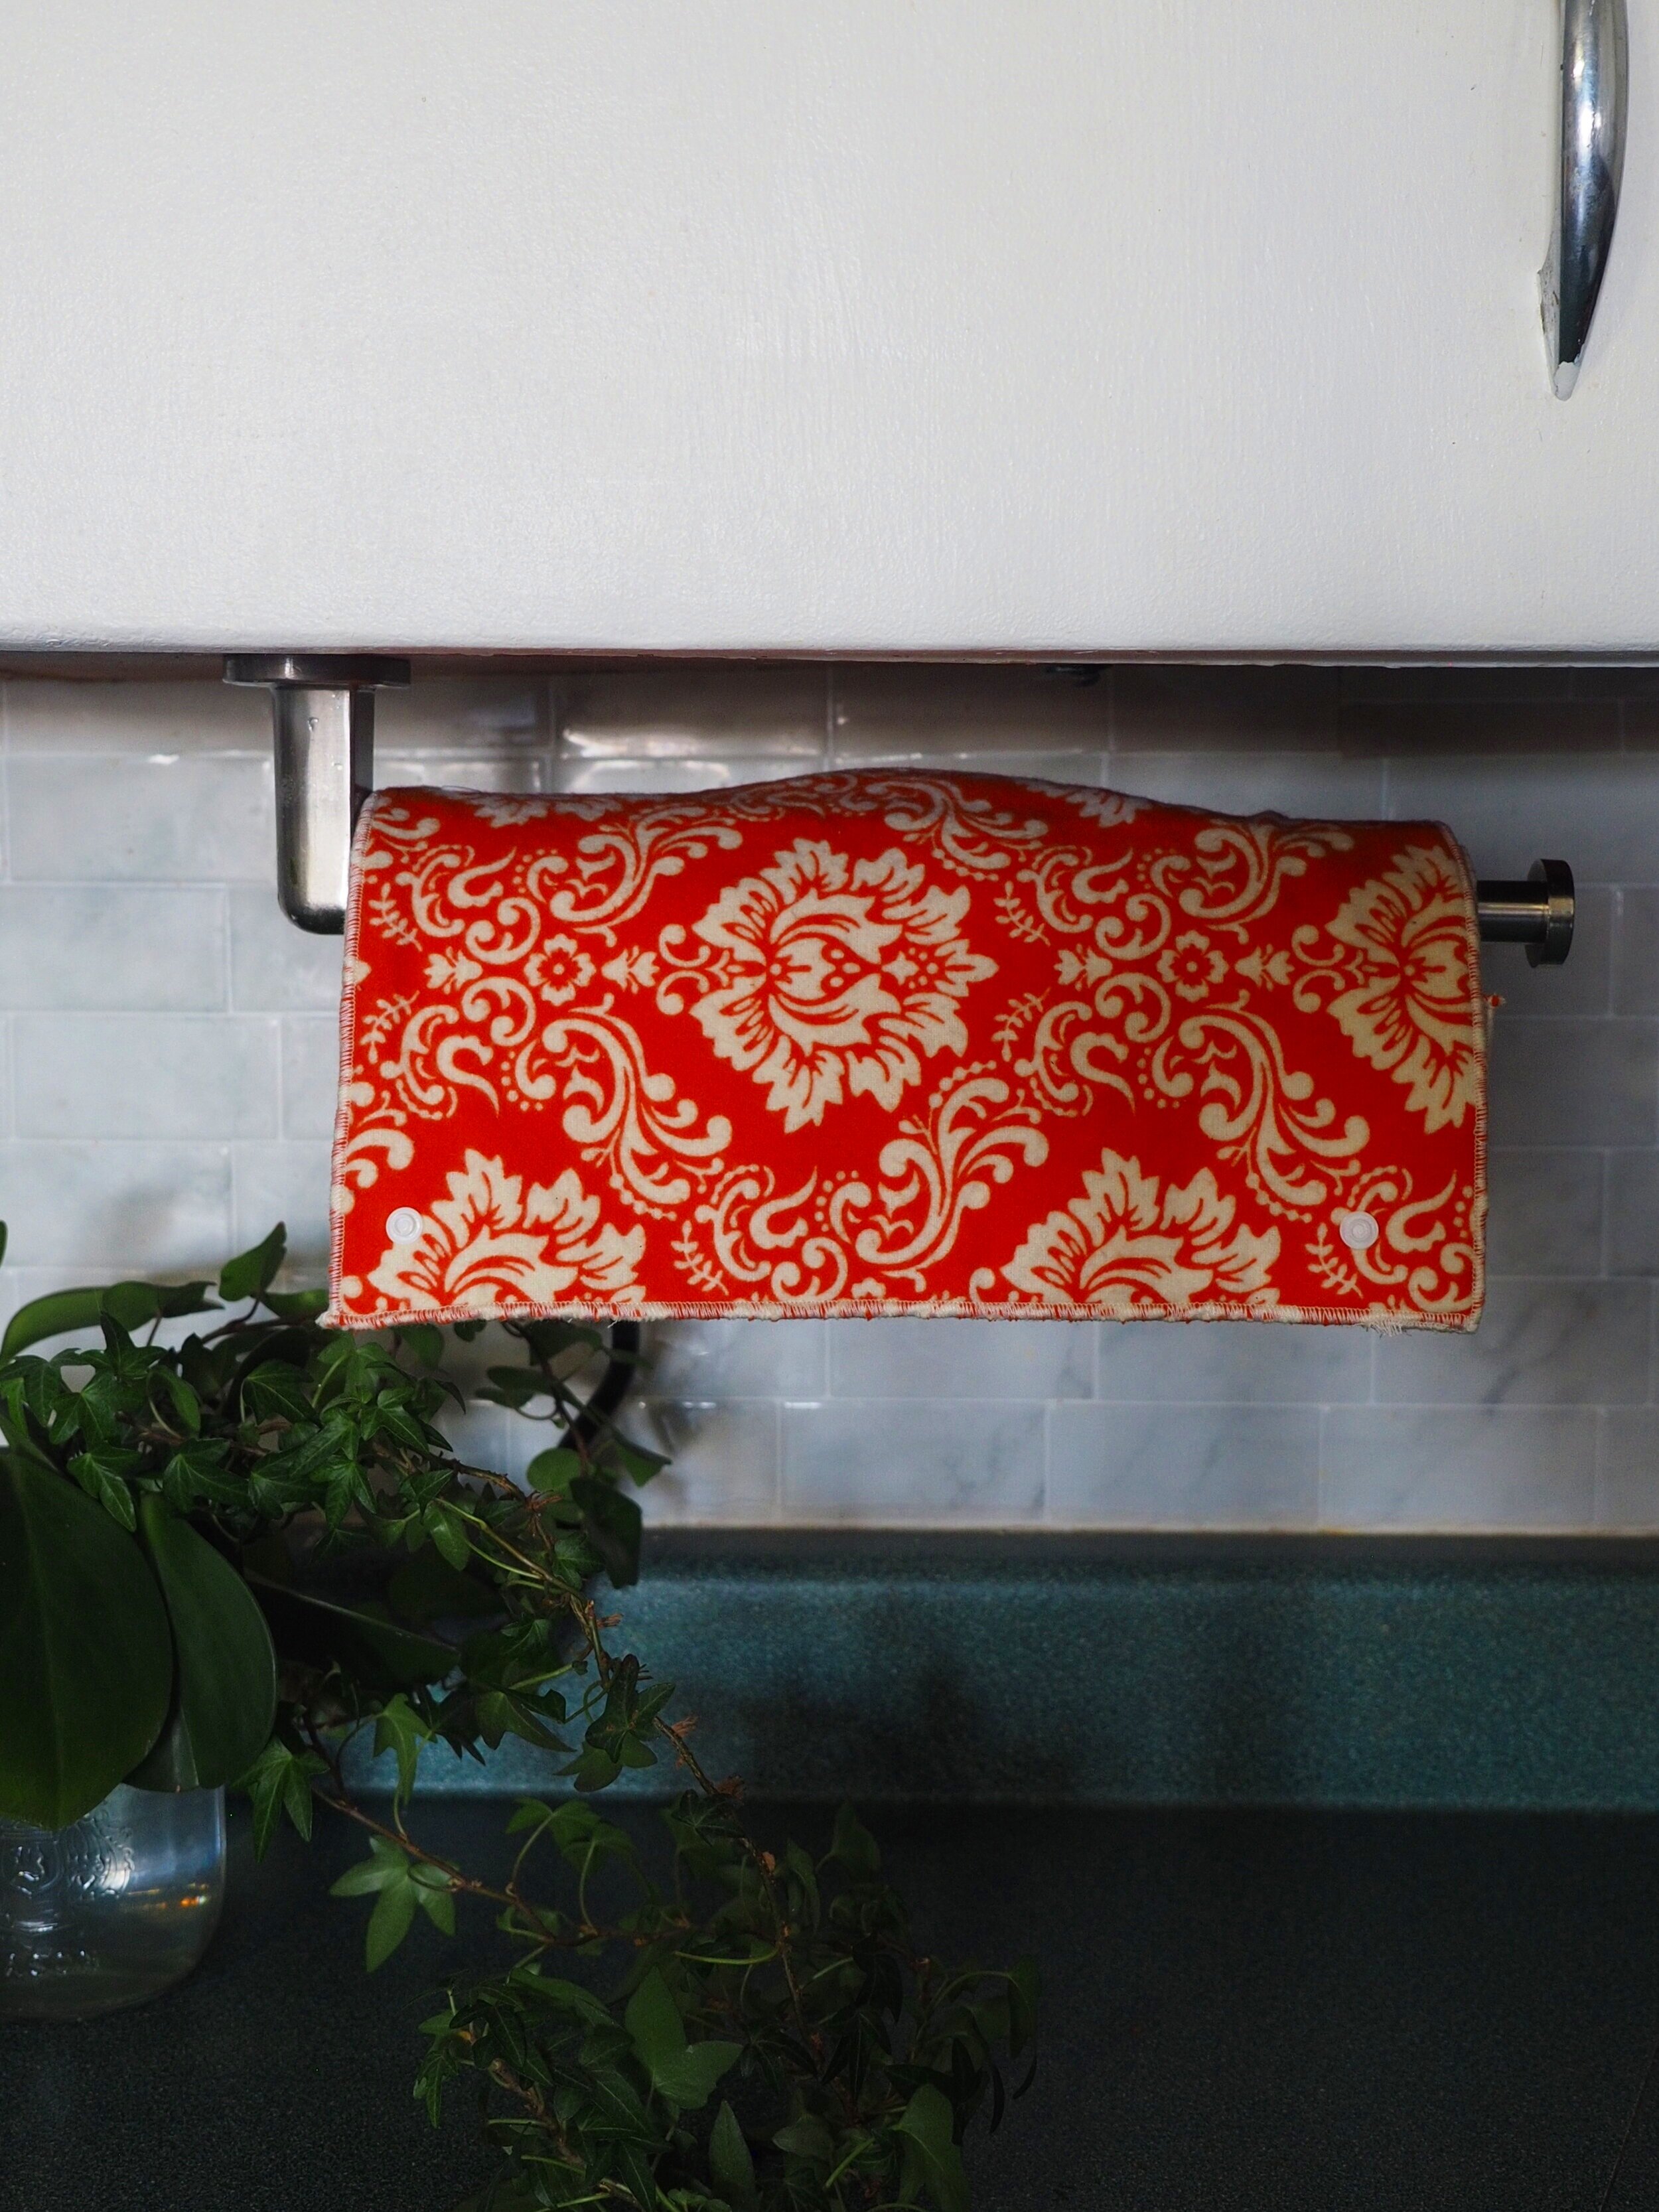
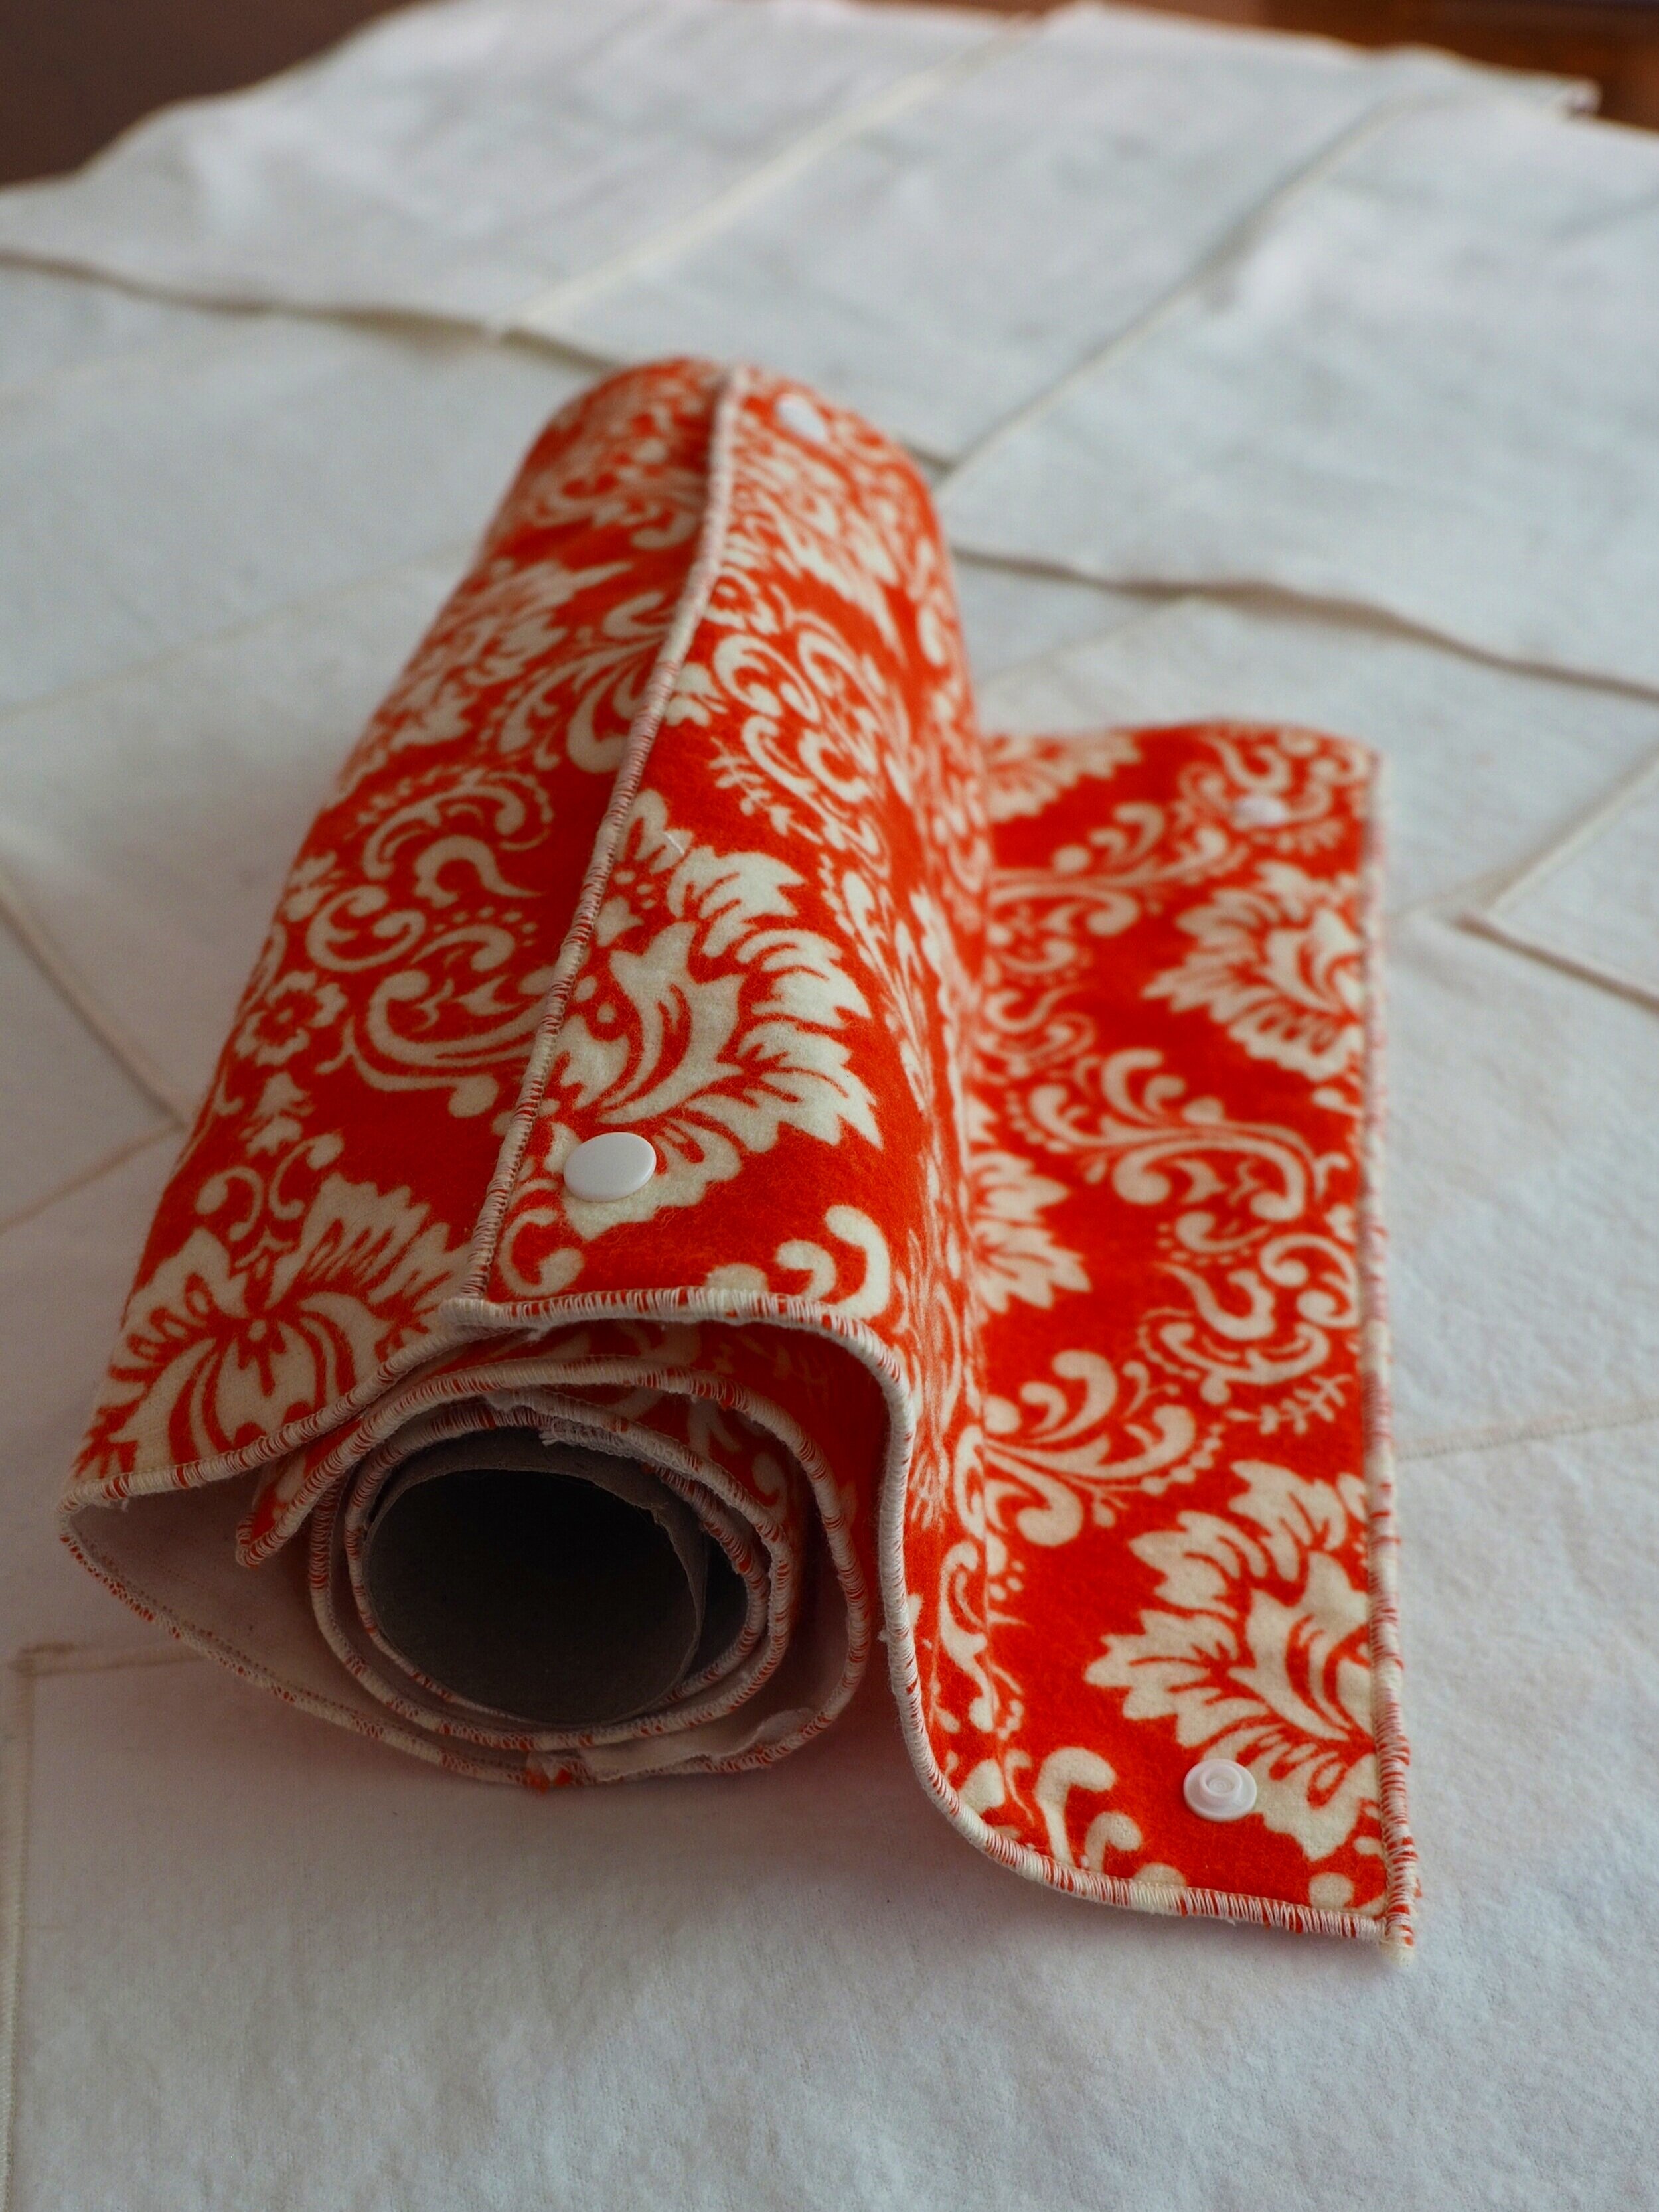
Step 8: Add snaps to an empty paper towel roll (only for snap option)
Here we installed two studs or male snap components pointing up through an empty paper towel roll 9” apart where the snap socket on the first towel will connect. This way when the towels connect to the roll the decorative side will be facing outward.
Step 9: Roll it up!
Looky here wiper-snappers, you’re almost done! Snap everything together and roll them up to finish your project.
Voila! These towels will last you for years, reduce your consumption, waste, and save you some dollars in the process. They also make great gifts for that zero-waste fan in your life.

The Elephant in the Stream
I’d like to talk about the elephant in the stream. That elephant being the estimated 10,000 cubic meters of creosote contaminating prime aquatic habitat for migratory birds and young fish, both freshwater and saltwater species. What is Marsh Creek? What is creosote? What is an elephant? Let’s get into it.
Marsh Creek & Associated Contamination
Marsh Creek is Saint John’s largest urban watershed. The stream runs from the headwaters in Golden Grove, through the City of Saint John’s East side, including much of the commercial district, and drains through the Courtenay Bay Causeway into the Saint John Harbour. The Marsh Creek watershed consists of multiple different main watercourses including Dutchman’s Creek, and Cold Brook. Many lakes are also within the system including Ashburn Lake, Harrigan Lake, Mystery Lake, etc., with many wetlands scattered throughout Saint John’s East side, including a tidal wetland at the mouth where the stream meets the Saint John Harbour. The lowest section of this stream, leading to the Causeway, is an estuary. Estuaries occur where freshwater meets saltwater and they are typically highly productive systems, hosting plenty of vegetative growth, birdlife, and acting as nursery grounds for young fish (both marine and freshwater species). This system therefore has a very large ecological significance.

Marsh Creek forebay with a view of the Saint John Harbour.
Marsh Creek is infamous for its frequent flooding through the low-lying sections on the East side of Saint John and because of the significant contamination it hosts. Up until 2014 it received untreated sewage inputs. ACAP Saint John has historic data leading up to this date showing extreme levels of fecal bacteria contamination in the water. While present day concentrations of fecal bacteria are still elevated at some sites in Marsh Creek, the levels are much lower than pre-2014 data (average fecal coliform counts of 96,550 cfu in 2013 compared to 620 cfu in 2018).
The contamination does not stop there though, there is a big, dark, oily, monster in the stream that needs to be defeated, for the sake of the wildlife depending on this habitat. A large area of this estuarine portion of the stream (the lower salty section) is contaminated with creosote-soaked sediment. Creosote is a petroleum-based product that comes from the incomplete combustion of wood and fossil fuels and its main components are polycyclic aromatic hydrocarbons (PAHs). PAHs are a class of organic contaminant that are highly toxic to wildlife and humans alike, some also being cancer-causing. PAHs also come from our car exhausts, industrial emissions, marine traffic, residential emissions (heating our homes), laying asphalt, etc. These chemicals collect in the fat tissues in wildlife and humans. Creosote has several uses, but in this case, it was used as a wood preservative at a lumber yard that was once located on the banks of Marsh Creek at Canada Post’s current location. There is currently a retaining wall that was built along the banks of the Canada Post property to stop any additional creosote from entering the stream.

Joseph A. Likely lumber yard on the banks of Marsh creek- 1917.

A sheen surfacing in Marsh Creek.
So, creosote is made of these toxic, cancer-causing building blocks (PAHs), and the Marsh Creek estuary is filled with it. An estimated 10,000 cubic meters of creosote-soaked sediment exists in the estuary. In parts of the stream even just touching the creek bed causes an oil sheen to rise to the surface of the water. It’s shocking to see it in person. This isn’t a contained system that will keep the contamination in one place. There is water rushing down over this contaminated area constantly, with a tide that comes in and out twice every day. Therefore, there is high potential for nasty things to migrate around the stream, down into Courtenay Bay, and into the Bay of Fundy. Wildlife moving through and feeding in the area could potentially participate in mobilizing the contamination through physical actions or by accumulating it in their tissues, too.

American Eel from Marsh Creek in 2019, photographed by Graeme Stewart-Robertson.
You might be thinking “there are no animals feeding in Marsh Creek… or the ones that are in there have two heads, so who cares?!” WELL, I can confirm that there are many migrating birds that pass-through and feed in Marsh Creek. There are also bountiful amounts of fish in even the contaminated estuarine portion of the stream. None of which have two heads. That I’ve seen. They are just out there trying to live their best lives in the contaminated conditions that have been left for them. Since last year we have fished a site ~500m downstream of the heavy contamination once per month (May to October) as part of the Harbour Baseline Monitoring program that I coordinate at ACAP. We collected 275 individuals across 11 species at this one site, including many American Eel, a threatened species. Unless they walked right into the mucky creosote, someone experiencing Marsh Creek for the first time likely wouldn’t know the stream was contaminated.
I knew very little about Marsh Creek before starting at ACAP in 2018. I knew about the presence of sewage contamination, but I didn’t know about the creosote. I have since learned plenty about it through documents from the ACAP archive, through members of our staff, and from doing field work in the stream. I think, like pre-ACAP Bethany, there are probably still plenty of people around our community who aren’t aware of how bad this is. I am hoping to reach a few of those individuals with this story.
Here’s a fun fact (not really fun at all) that we learned this year: Total PAH concentrations (the toxic building blocks for creosote) in the most highly contaminated part of the stream ranged from 25-9700 mg/kg in 2018-2019 (n=16). The disposal at sea limit for total PAHs is 2.5 mg/kg. This shows that these toxic contaminants in Marsh Creek sediment are occasionally up to almost 4000 times higher than the limit above which they are considered too hazardous to dispose of in the ocean. Not to mention that these concentrations are far beyond any guidelines that are made for protecting the health of fish and wildlife being exposed, and beyond anything we’ve measured elsewhere in the Harbour. This is a problem. We know it is a problem. A lot of people in the City know it is a problem. We just haven’t had this data publicly available before to give us the kick in the pants we need to do something about it.
ACAP’s Pilot Project to Reduce Sediment PAHs
So, I think this is the part where things start to get happier and a bit more productive...

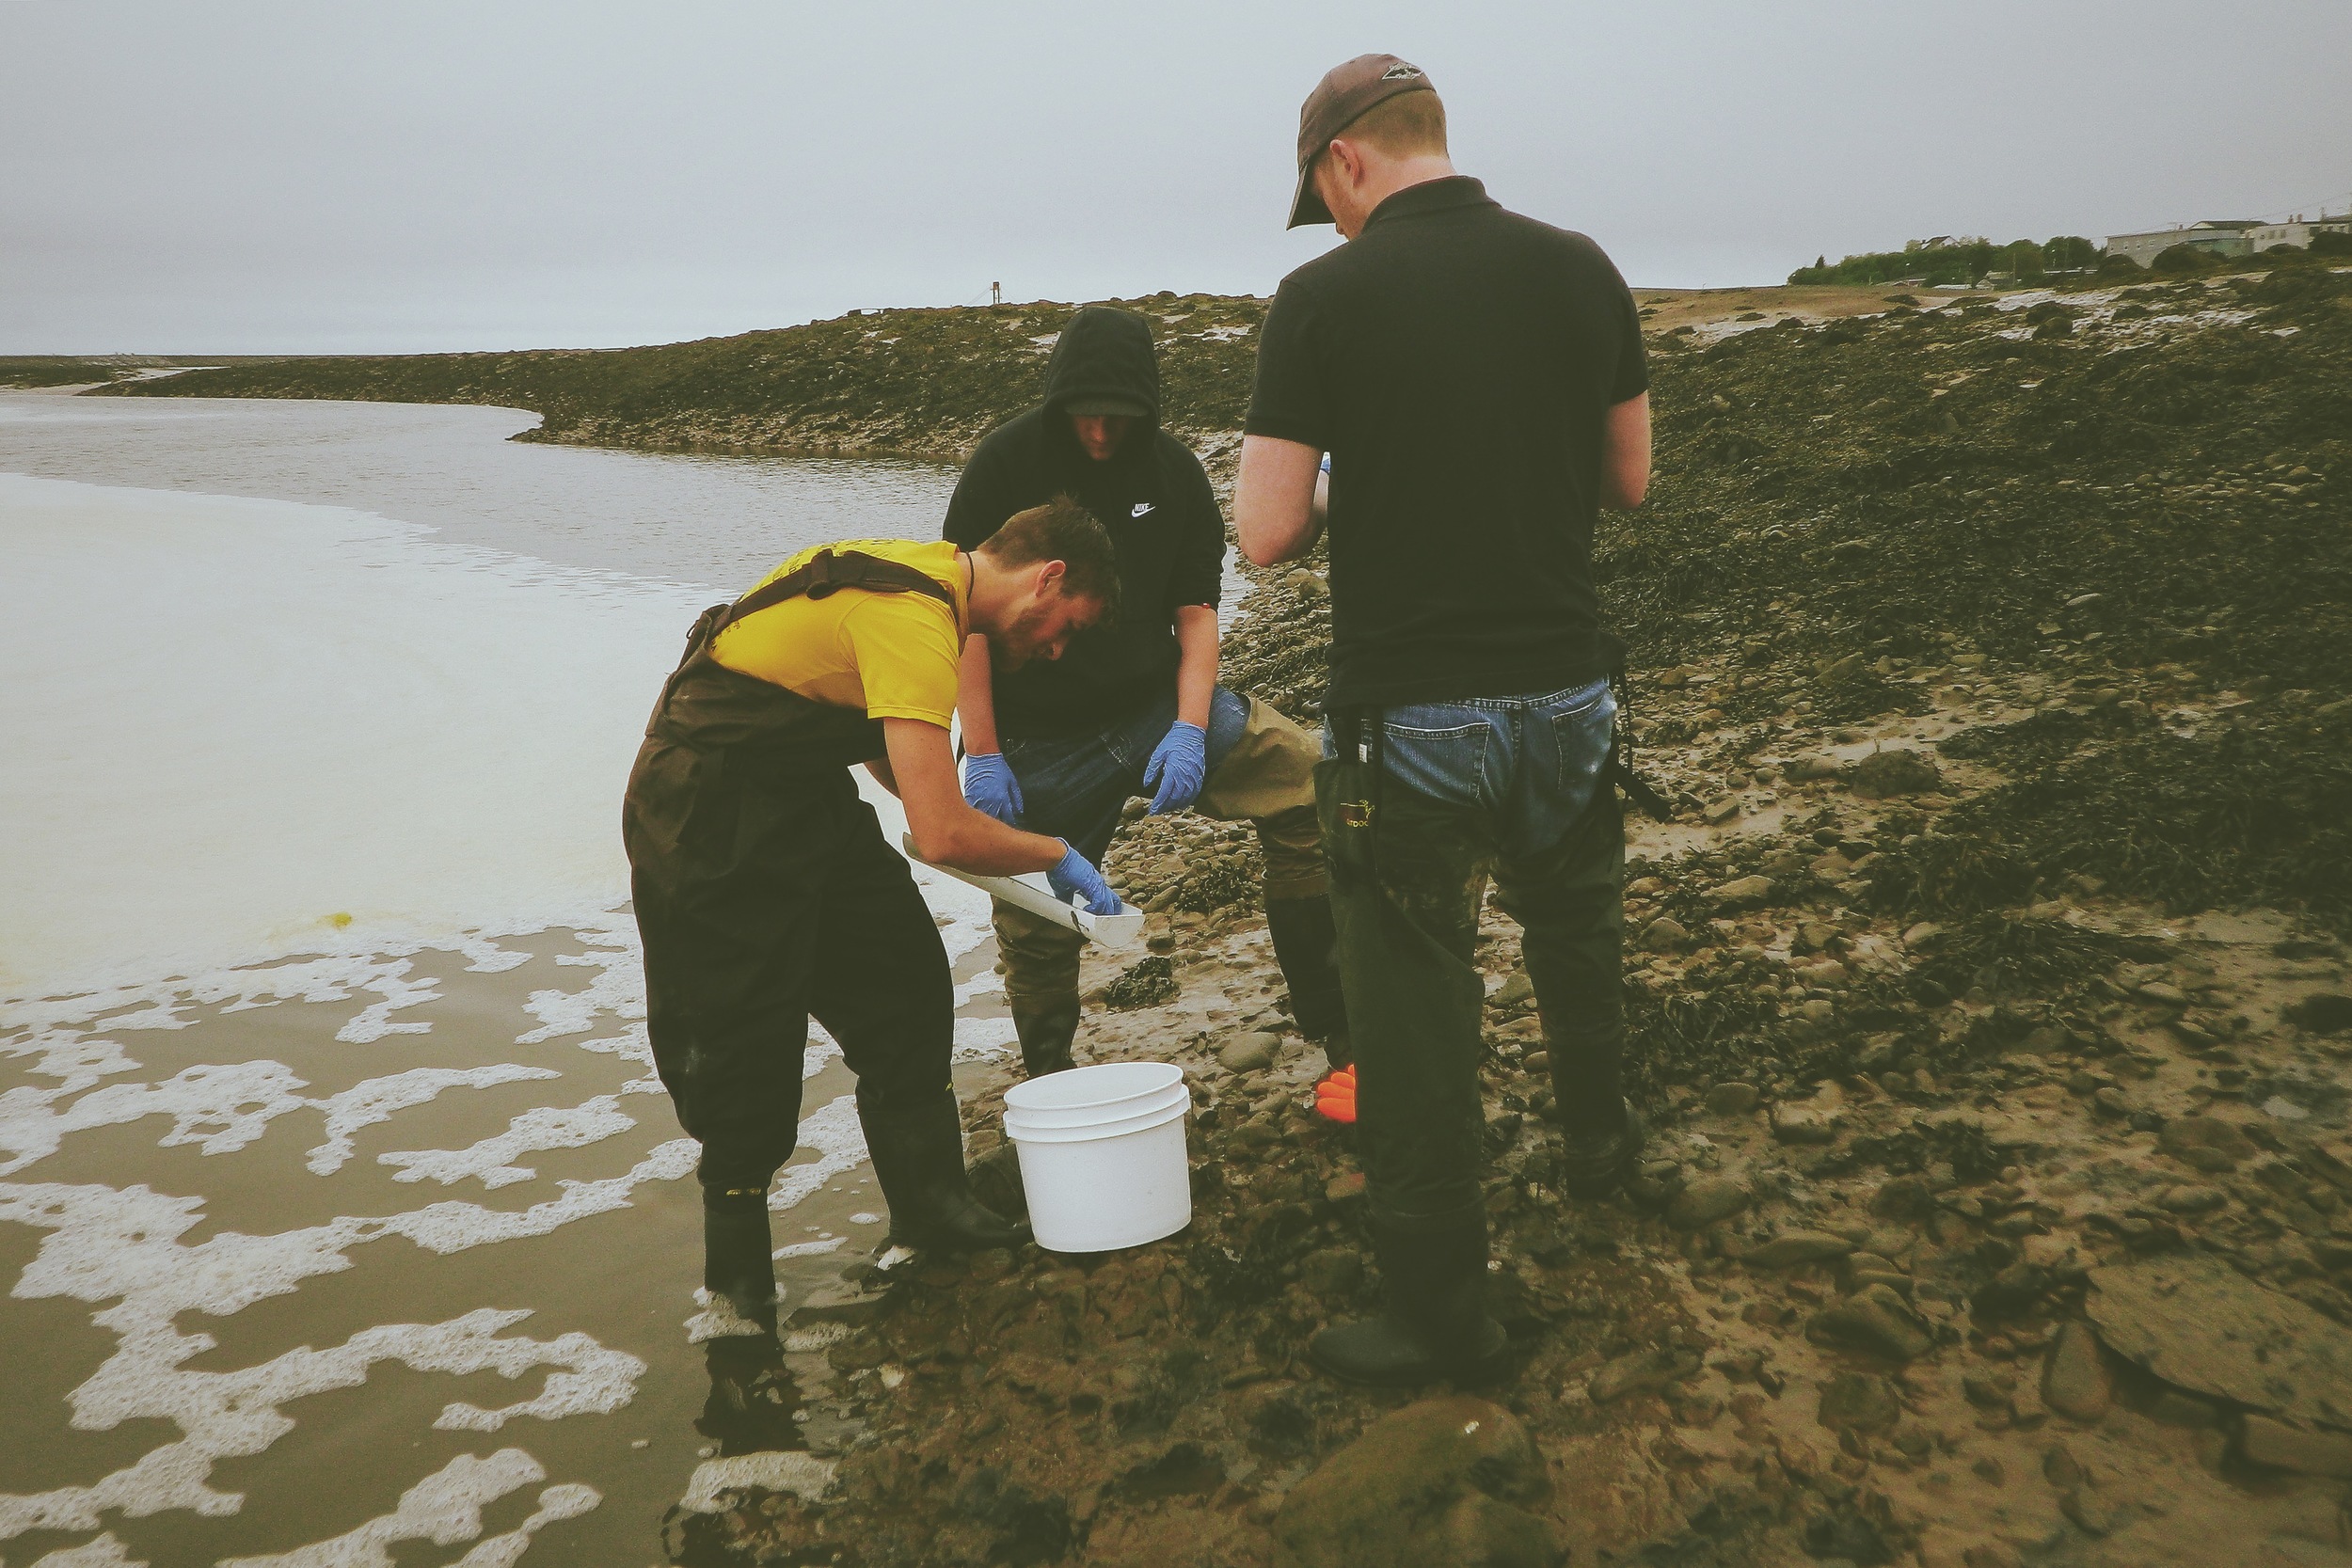
Chemical technologist Scott Stephen while adding bacterial spikes to Marsh Creek sediments in 2018.
ACAP Saint John has been working on a pilot project over the past two summers to test the effectiveness of hydrocarbon (PAHs are a hydrocarbon) degrading bacteria in the stream (thanks to past summer student Scott Stephen, past board member Rick Russell, and Novozymes). The bacteria are purchased in pellet form and added to the sediment ~each week throughout the warmest summer months (the warm weather promotes the bacterial growth). We’ve been collecting sediment samples to analyze for PAH concentrations throughout this project and I’ve been interpreting the data we get back.
There had been talk in previous years about physically removing and disposing of the contaminated sediment in the stream. But when considering ownership of the contaminated sediment and the high economic and ecological cost of physically isolating, removing, and disposing of the sediment, it hasn’t yet happened. That is where our pilot project came in. If this method is effective it may be a minimally invasive and likely more affordable way of reducing concentrations of toxic PAHs in the sediment, potentially returning them to acceptable levels one day. Although, this will likely take longer than physical remediation.
Within the contaminated area we had a test site (where bacteria were added) and a control site (where no bacteria were added), and we have been comparing concentrations of PAHs over time. If you look at the figures below you may notice that in 2018 total PAH concentrations were lower at the test site than at the control site, which is what we would expect if the bacteria were working effectively to reduce the toxins. However, this was not consistent with 2019 measures, as the test site showed similar or higher concentrations than the control site. Overall though, 2019 concentrations at both sites were lower than they were in 2018. The test site had an average total PAH concentration (± standard deviation) of 2528 ± 1601 mg/kg in 2018 and 609 ± 399 mg/kg in 2019. The control site similarly decreased in total PAHs with 4438 ± 3224 mg/kg in 2018 and 758 ± 1255 mg/kg in 2019. So, concentrations did go down, but was it related to the bacteria or more to external environmental factors? It is unclear since concentrations have decreased at our control site where no bacteria were added, as well. But it is possible that the bacteria are moving from our test site to the control site to reduce concentrations there, too, since it is part of the same system. This data is therefore not yet enough to tell us whether the bacteria are effectively reducing PAH concentrations at the test site and further testing is necessary in order to do so.
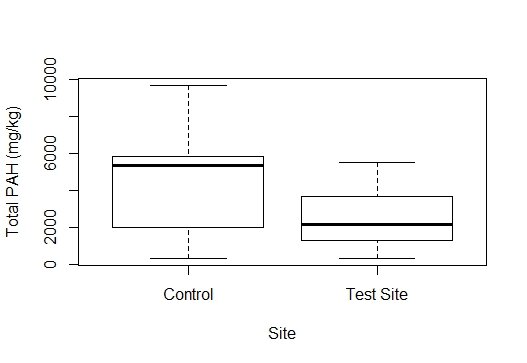
Total PAH concentrations at the test site (hydrocarbon degrading bacteria added; n=21) versus a control site (no bacteria added; n=7) in 2018.
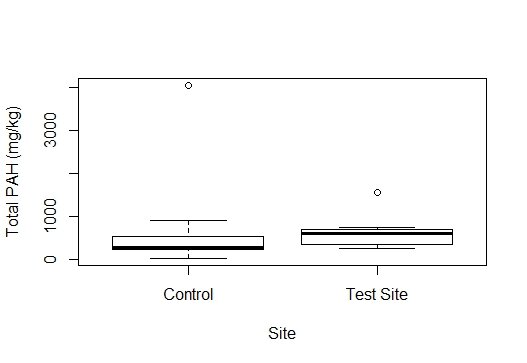
Total PAH concentrations at the test site (hydrocarbon degrading bacteria added; n=9) versus a control site (no bacteria added; n=9) in 2019.
With the help of ACAP staff member Arthur Szymanski we are going to tweak our study design for next year and do more applications of the bacterial spikes. We are going to ask the questions 1) Are the spikes effective in this environment? 2) By how much are the spikes reducing concentrations in the sediment at the test site versus the control site? 3) At what rate are concentrations declining at the test site? and 4) How long will it take for concentrations to return to acceptable levels? Stay tuned next year for more results from this project as we try to answer these questions and reduce PAHs in Marsh Creek.
Concluding Statement
It has been over a century that Marsh Creek has seen the impacts from human inputs or actions, from historic (and occasionally current) sewage contamination, to the Courtenay Bay Causeway altering natural flow and fish migration, and the ~10,000 cubic meters of creosote that soaks the sediment. Despite these alterations it is still a beautiful stream with plenty of resident and visiting wildlife. But it is now time to give back another part of what the ecosystem once was before human interference. With the Harbour Cleanup efforts in 2014, sewage in the stream was reduced. Now we hope to bring back uncontaminated sediment that will support a healthy estuary and food web.

Me and Andrew Shaddick setting up a fyke net in the Marsh Creek Forebay.